Coalition for Healthy Democracy · August 2026 · Analysis by Opinion Diagnostics
Some opponents of Question 3 have raised a serious concern about money. As the Boston Globe reported, opponents argue that all-party primaries “increase the power of candidates who can self-fund their own campaigns,” and that the system “increases the power of big money.”
It’s a fair question and deserves a rigorous answer. We commissioned an analysis from Opinion Diagnostics of campaign-finance and election records from two states with All-Party Primaries: California and Washington — FollowTheMoney.org, the FEC, and both states’ disclosure agencies — covering roughly 13,400 candidacies across contested state and federal races, 2000–2024, covering the period before and after their move to All-Party Primaries. (More than 21,000 candidate records were included when uncontested races and special elections are counted.)
The answer: after All-Party Primaries money did not become more powerful. It actually “buys” less than it used to, and the clearest evidence is in who actually wins an election.
Key findings
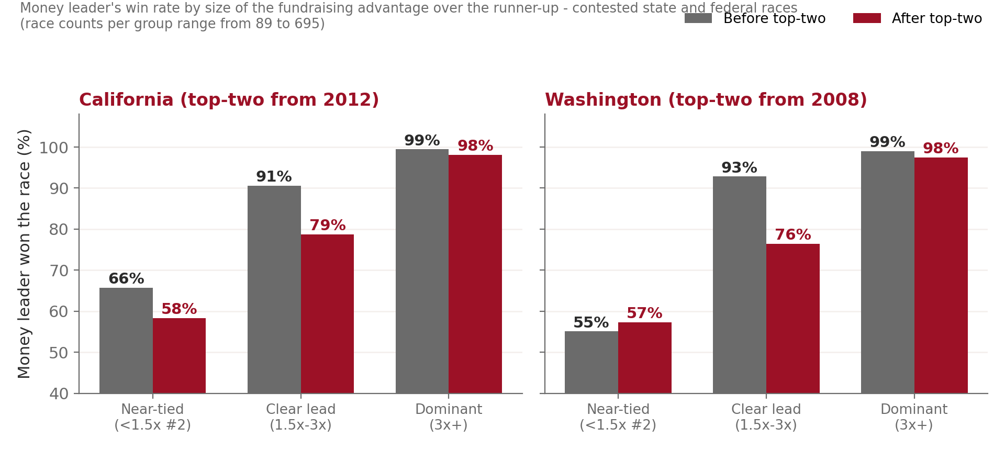
- A clear money lead (1.5x–3x the runner-up) used to win about 9 races in 10. Under all-party primaries it wins about 3 in 4.
- The top fundraiser wins less often: California 94% → 90%, Washington 89% → 86%.
- Winning didn’t get more expensive. The median winning California statewide campaign fell from $5.7 million to $3.0 million; legislative races cost about what they did 20 years ago.
- The largest self-funded campaign ever run under an all-party primary — Tom Steyer’s $215 million for California governor in 2026 — finished third.
- Massachusetts’s rules are tougher on big money than either test state: a $1,000 contribution cap, a corporate ban, and signature-only ballot access. None of that changes under Question 3.
A clear money lead doesn’t guarantee a win anymore
Before the reform, a candidate with a clear-but-not-overwhelming fundraising lead (1.5x to 3x the runner-up) won about nine races in ten. Today that same lead wins about three in four. Near-tied money was always close to a coin flip, and a truly dominant lead (3x or more) still wins the vast majority of the time — money hasn’t stopped mattering. But the middle band, where a real financial edge used to be close to decisive, has weakened in both states.
In addition:
- The single biggest fundraiser wins less often, too. California: 94.1% → 90.0% (statistically significant). Washington: 88.7% → 86.0%.
- Where a dominant money advantage should matter most — open seats with no incumbent — it’s less safe than before. In California, a 3x+ money lead in an open seat won 98% of the time before the reform, 95% after. In Washington it’s starker: before adoption, a dominant money lead in an open seat never lost; since, it wins 88% of the time.
- Upsets are up. The second-highest fundraiser now wins 9.1% of California legislative races, up from 5.5% — roughly 65% more common.
Winning doesn’t cost more money
If the reform were driving a fundraising arms race, campaigns should be getting more expensive. They aren’t — not in statewide races, not in legislative races, and not in congressional races relative to the rest of the country.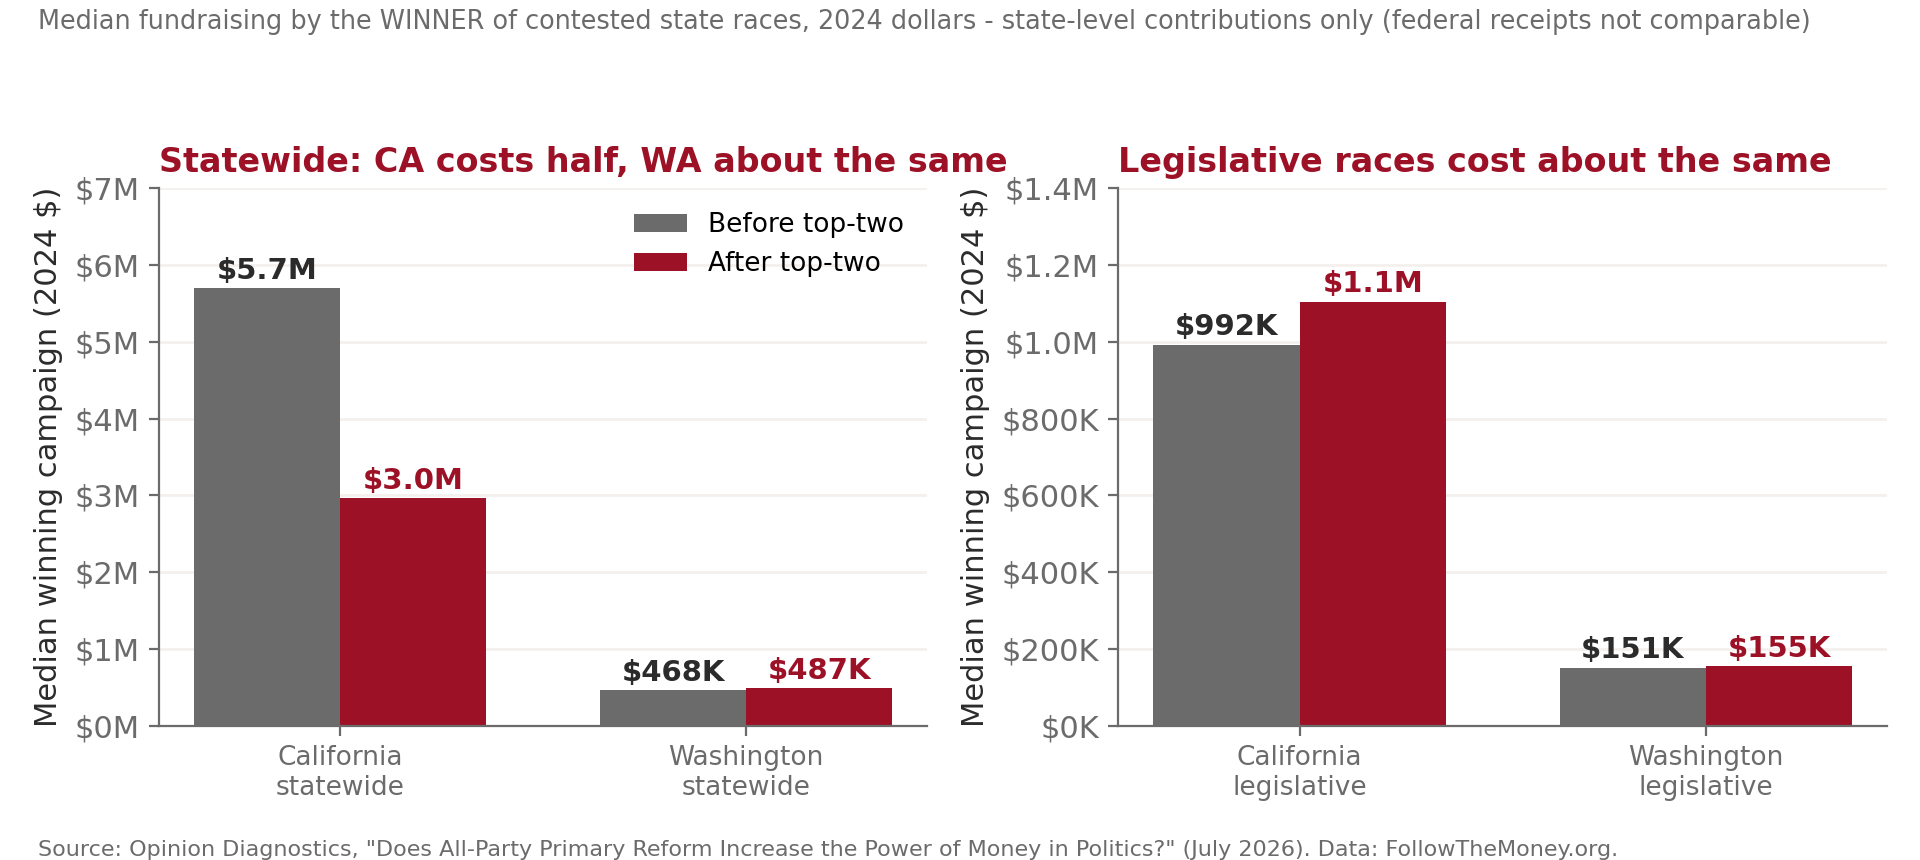
- Winning a California statewide race now costs about half what it did. The median winning campaign fell from $5.7 million to $3.0 million, in 2024 dollars.
- Legislative races cost about the same as they did twenty years ago, adjusted for inflation, in both states (California: $992K → $1.10M; Washington: $151K → $155K) — no arms race, just small movement.
While Congressional races have become more expensive in both states, that is not attributable to their implementation of All-Party Primaries because that is true across the country in all primary systems. We reviewed all contested U.S. House races in America from 2000–2024 (5,256 races) using FEC fundraising data, then compared California and Washington U.S. House races to the national trend. If the reform drove up the price of winning, the two reform states should have pulled away from the country. They didn’t.
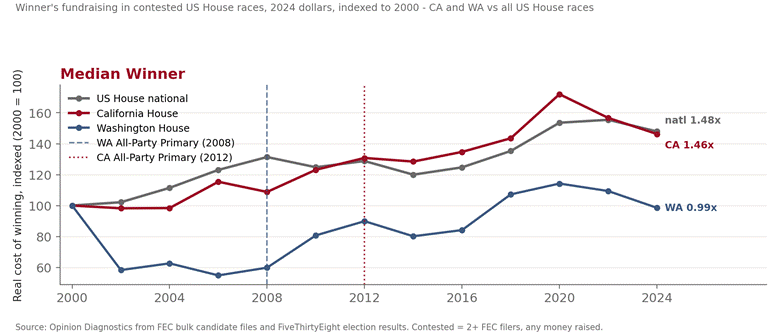
The typical winning campaign in CA and WA grew at the same rate as the nation’s. In real terms, the median winner of a contested U.S. House race raised 1.46x more in California in 2024 than in 2000 — versus 1.48x nationally. Statistically identical, and most of the growth in every series came after 2016, under every kind of primary system.
We use the median — the middlemost winning campaign — because it is the measure least distorted by a handful of outliers, and by that measure California and Washington track the country. If you analyze by averages, there is a California spike in 2018–2022 driven by five members — Kevin McCarthy, Nancy Pelosi, Adam Schiff, Katie Porter, and Devin Nunes — who each raised $17–29 million per cycle. That money reflects party leadership and national small-dollar celebrity, not what it cost to win those districts. The spike then resolved on its own: as Nunes, Porter, and Schiff left the House and McCarthy and Pelosi left leadership, California’s average converged back to the national trend by 2024 with nothing removed from the data. Set those five aside during the spike years and California’s average winner, about $2.3M, sits on the national trend then too.
This Congressional District analysis shows that All-Party Primaries are not a significant driver of increased money in Congressional races.
What this analysis counts — and what it can’t
Every dollar here is money raised by candidate committees. That’s deliberate: candidate money is the only money disclosed dollar-for-dollar under the same rules, in both states, on both sides of adoption. Outside spending can’t be counted the same way — much of it flows through nonprofits that never disclose donors, and many super PACs operate across multiple races and states with expenses attributed to no candidate. The published evidence that does exist suggests adding outside money doesn’t change who-wins results: when OpenSecrets combined outside-group and candidate spending for the 2020 cycle, the share of races won by the bigger spender was “nearly identical” to candidate spending alone.
Self-funders still have a losing record
The largest self-funded campaign ever run under an all-party primary just failed. In June 2026, billionaire Tom Steyer spent more than $215 million of his own money on the California governor’s race — the most any candidate has ever spent on a single California campaign — and finished third, missing the general election entirely.
Why California isn’t a preview of Massachusetts
The two states answer two different questions. Washington — whose contribution limits are close to ours — is the question “what happens when a state with rules like Massachusetts’ adopts this reform?” The answer: money was no more powerful. California — where limits run up to 80 times higher and corporations can give directly — is the question: “does the result hold even where money rules are far looser?” Answer: It does. Washington tells us what to expect here; California shows the results survive conditions much worse than ours. And every way Massachusetts differs — lower limits, the corporate ban, signature-based ballot access — differs in the direction that makes big money weaker here, not stronger.
Contribution limits are different. Massachusetts caps direct contributions to candidates at $1,000 per candidate per calendar year — the same for state rep or governor — and bans direct corporate contributions to candidates outright. California sets limits per election, with much higher rates — and in California corporations can give directly. A donor can give a California governor candidate nearly 80 times what the same donor could give a Massachusetts governor candidate in an election year, directly to the campaign. None of that changes under this reform. Washington’s limits are much closer to ours ($1,200/election to legislative candidates) — and Washington’s evidence is that money is not getting more powerful post-reform.
Direct contribution limits to candidates.
| Legislative | Statewide (non-gov.) | Governor | Corporate contributions | |
|---|---|---|---|---|
| Massachusetts | $1,000/calendar year | $1,000/calendar year | $1,000/calendar year | Banned outright |
| California (2025–26) | $5,900 | $9,800 | $39,200 | Permitted, direct from treasury |
| Washington (2025–26) | $1,200 | — | $2,400 | Corporate limits mirror individual limits |
Getting on the ballot is different too. Worries about how a crowded field would privilege the most well-resourced depend partly on how easy it is to get on the ballot in the first place. California and Washington both let a candidate qualify for the ballot with a filing fee alone; if the fee is paid, no signatures are required at all. Massachusetts has no such shortcut. Every candidate — self-funded or not — must gather certified signatures from registered voters: 10,000 for governor, 300 for state senate, 150 for state house, with no fee-only alternative.
Bottom line
Across California and Washington: after All-Party Primaries a moderate money lead wins fewer races than it used to. In All-Party Primaries in these states, dominant money is less automatic in the open seats where it should count most, upsets are up, winning state office costs the same or less than it did twenty years ago, and the single largest self-funded campaign ever run under an all-party primary just lost badly. None of that means money stopped mattering. What the data shows is that in California and in Washington, money is not getting any more powerful. Combine that with Massachusetts’s contribution limits, corporate ban, and signature-based ballot access — none of which change under this reform — means that in Massachusetts it is a tougher environment for big money to operate in than either test state.
Data and Methodology
Candidate fundraising from FollowTheMoney.org and the FEC, 2000–2024, covering roughly 13,400 candidacies in contested state and federal races in California and Washington (16,000+ candidate records including uncontested and special elections); analysis by Opinion Diagnostics. All dollars in 2024 terms. Contribution limits from the Massachusetts Office of Campaign and Political Finance, the California Fair Political Practices Commission (2025–26 cycle), and the Washington Public Disclosure Commission; these govern direct contributions to candidate committees only — independent expenditures and party-committee giving follow separate rules in all three states. Ballot-access rules from each state’s Secretary of State. 2026 Steyer figures from NBC News (June 9, 2026) and Bloomberg (June 10, 2026). Full data tables and sources are in the PDF.
Download: Full memo with appendix (PDF)
Related: How Question 3 works · Who is funding Question 3? · Could two candidates from the same party face off in November?
Questions about this analysis? Contact Jesse Littlewood, Campaign Manager, Coalition for Healthy Democracy.
Make your representative work for your vote. Vote YES on Question 3 — sign up to help.